import matplotlib.pyplot as plt
# Data for the allele frequencies
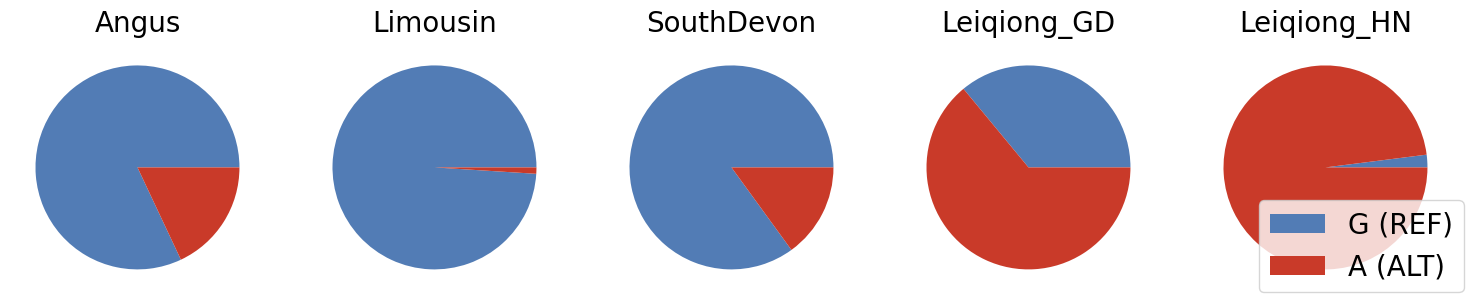
breeds = ['Angus', 'Limousin', 'SouthDevon', 'Leiqiong_GD', 'Leiqiong_HN']
ref_frequencies = [0.82, 0.99, 0.85, 0.36, 0.02]
alt_frequencies = [1 - freq for freq in ref_frequencies]
# Colors for REF and ALT alleles
colors = ['#527CB5', '#C93A29']
labels = ['G (REF)', 'A (ALT)'] # Labels for the legend
# Creating pie charts for each breed
fig, axes = plt.subplots(nrows=1, ncols=len(breeds), figsize=(15, 3))
for i, breed in enumerate(breeds):
ax = axes[i]
wedges, _ = ax.pie([ref_frequencies[i], alt_frequencies[i]], colors=colors)
ax.set_title(breed, fontsize=20) # Setting the font size for breed names
# Adding a legend in the bottom right corner
fig.legend(wedges, labels, loc='lower right', fontsize=20)
plt.tight_layout()
plt.savefig('freq.pdf') # Saving the figure to a PDF file